كانتونات كوستاريكا
| كوستاريكا |
 هذه المقالة هي جزء من سلسلة: |
|
|
|
دول أخرى • أطلس بوابة السياسة |

Costa Rica is administratively divided into seven provinces which are subdivided into 84 cantons, and these are further subdivided into districts. Cantons are the only administrative division in Costa Rica that possess local government in the form of municipalities. Each municipality has its own mayor and several representatives, all of them chosen via municipal elections every four years.
The original 14 cantons were established in 1848, and the number has risen gradually by the division of existing cantons. Law no. 4366 of 19 August 1969, which outlines the creation of administrative divisions of Costa Rica, states that new cantons may only be created if they have at least one percent of the republic's total population, which was 5٬044٬197 as of the latest estimate (2022).[1][2][أ] The newest canton, Puerto Jiménez, was created on June 21, 2022, from the canton of Golfito.[3]
According to the latest population estimate from the National Institute of Statistics and Census, the largest canton by population is the capital San José with a population of 352٬381, while the smallest by population is Monteverde with 5٬386 residents.[4] The latest report from the National Geographic Institute listed the largest canton by land area as San Carlos, which spans 3،352.14 km2 (1،294.27 sq mi) and the smallest as Flores at 6.75 km2 (2.61 sq mi).[5]
الهيكل السياسي
Each canton is controlled by a government unit called Municipalidad.[6] The term reflects the fact that the cantons in Costa Rica have approximately the same function as municipios ("municipalities") in many other Spanish-speaking countries. This administrative unit consists of two bodies: a municipal council (Concejo Municipal) and an executive officer called a mayor (alcalde / alcaldesa municipal), a title that was introduced in 1998.[6]
The mayor's main duties are to liaise with the municipal council, district councils and the entire administrative apparatus of the canton, and to approve and implement the decisions taken by the municipal council.[7] The number of members of the municipal council varies from one canton to another, and they are elected by local elections held every four years.[8] The head of the council is titled the municipal president (presidente municipal). The council's main task is to manage the canton at the local level, and is responsible for planning basic policies and establishing budgets. More specifically, the responsibilities include urban and agricultural planning and organizing cultural affairs, health care, education and industry.[9] Each municipal president appoints a number of working commissions that deal with issues specific to the municipality.[10]
المدن في كوستاريكا
According to the Executive Decree N°41548-MGP (Declara oficial para efectos administrativos, la aprobación de la División Territorial Administrativa de la República), a city in Costa Rica is a ceremonial title awarded to a district or districts which contain the administrative center regardless of factors such as population, population density, or economic indicators. This designation is also known as cabecera de cantón, head city of the canton.[11]
الكانتونات
- أكبر الكانتونات في كوستاريكا حسب التعداد
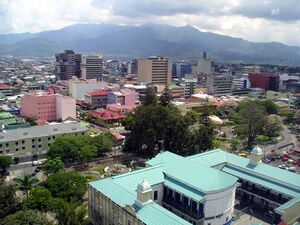
سان خوسيه، عاصمة كوستاريكا وأكبر كانتون حسب التعداد
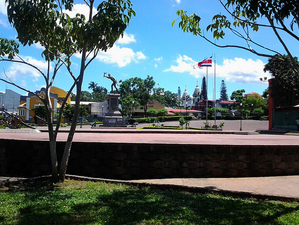
ألاخويلا، ثاني أكبر كانتون في كوستاريكا حسب التعداد
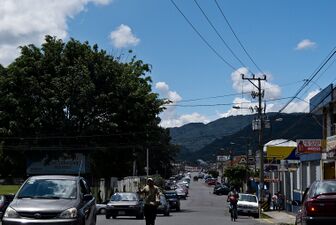
Desamparados, Costa Rica's third largest canton by population and suburb of San Jose
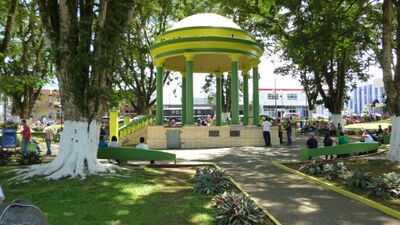
Pavilion of Ciudad Quesada, located in Costa Rica's fourth largest canton by population, سان كارلوس


Provincial Capital![]()
National Capital and Provincial Capital![]()
| الكانتون | المدينة[11] | المحافظة | Population (2022)[أ][2][4] |
Population (2011)[12] |
التغير | المساحة البرية (كم²)[5] | الكثافة السكانية (2022)[أ][2] | Incorporation date[13] |
|---|---|---|---|---|---|---|---|---|
| سان خوسيه |
San José | سان خوسيه | 352٬381 | 288٬054 | +22٫3% | 44٫62 | 7٬897٫4/km2 | 1848 |
| Escazú | Escazú | سان خوسيه | 71٬500 | 56٬509 | +26٫5% | 34٫53 | 2٬070٫7/km2 | 1848 |
| Desamparados | Desamparados | سان خوسيه | 223٬226 | 208٬411 | +7٫1% | 118٫89 | 1٬877٫6/km2 | 1862 |
| Puriscal | Santiago | سان خوسيه | 38٬525 | 33٬004 | +16٫7% | 555٫02 | 69٫4/km2 | 1868 |
| Tarrazú | San Marcos | سان خوسيه | 17٬810 | 16٬280 | +9٫4% | 291٫27 | 61٫1/km2 | 1868 |
| Aserrí | Aserrí | سان خوسيه | 59٬588 | 57٬892 | +2٫9% | 168٫26 | 354٫1/km2 | 1882 |
| Mora | Colón | سان خوسيه | 32٬348 | 26٬294 | +23�0% | 163٫47 | 197٫9/km2 | 1883 |
| Goicoechea | Guadalupe | سان خوسيه | 132٬104 | 115٬084 | +14٫8% | 31٫7 | 4٬167٫3/km2 | 1891 |
| Santa Ana | Santa Ana | سان خوسيه | 58٬020 | 49٬123 | +18٫1% | 61٫42 | 944٫6/km2 | 1907 |
| Alajuelita | Alajuelita | سان خوسيه | 81٬012 | 77٬603 | +4٫4% | 21٫47 | 3٬773٫3/km2 | 1909 |
| Vázquez de Coronado | San Isidro | سان خوسيه | 67٬078 | 60٬486 | +10٫9% | 223٫93 | 299٫5/km2 | 1910 |
| Acosta | San Ignacio | سان خوسيه | 22٬542 | 20٬209 | +11٫5% | 342٫56 | 65٫8/km2 | 1910 |
| Tibás | San Juan | سان خوسيه | 74٬592 | 64٬842 | +15�0% | 8٫27 | 9٬019٫6/km2 | 1914 |
| Moravia | San Vicente | سان خوسيه | 59٬546 | 56٬919 | +4٫6% | 28٫82 | 2٬066٫1/km2 | 1914 |
| Montes de Oca | San Pedro | سان خوسيه | 53٬862 | 49٬132 | +9٫6% | 15٫78 | 3٬413٫3/km2 | 1915 |
| Turrubares | San Pablo | سان خوسيه | 6٬173 | 5٬512 | +12�0% | 416٫25 | 14٫8/km2 | 1920 |
| Dota | Santa María | سان خوسيه | 9٬364 | 6٬948 | +34٫8% | 404٫44 | 23٫2/km2 | 1925 |
| Curridabat | Curridabat | سان خوسيه | 71٬026 | 65٬206 | +8٫9% | 16٫06 | 4٬422٫5/km2 | 1929 |
| Pérez Zeledón | San Isidro de El General | سان خوسيه | 156٬917 | 134٬534 | +16٫6% | 1٬901٫08 | 82٫5/km2 | 1931 |
| León Cortés Castro | San Pablo | سان خوسيه | 13٬553 | 12٬200 | +11٫1% | 121٫89 | 111٫2/km2 | 1961 |
| Alajuela |
Alajuela | Alajuela | 322٬143 | 254٬886 | +26٫4% | 391٫62 | 822٫6/km2 | 1848 |
| San Ramón | San Ramón | Alajuela | 93٬264 | 80٬566 | +15٫8% | 1٬021٫74 | 91٫3/km2 | 1856 |
| Grecia | Grecia | Alajuela | 76٬226 | 76٬898 | −0٫9% | 142٫47 | 535�0/km2 | 1848 |
| San Mateo | San Mateo | Alajuela | 6٬952 | 6٬136 | +13٫3% | 125٫03 | 55٫6/km2 | 1868 |
| Atenas | Atenas | Alajuela | 30٬407 | 25٬460 | +19٫4% | 126٫31 | 240٫7/km2 | 1868 |
| Naranjo | Naranjo | Alajuela | 46٬647 | 42٬713 | +9٫2% | 127٫01 | 367٫3/km2 | 1886 |
| Palmares | Palmares | Alajuela | 39٬148 | 34٬716 | +12٫8% | 38٫94 | 1٬005٫3/km2 | 1888 |
| Poás | San Pedro | Alajuela | 36٬207 | 29٬199 | +24�0% | 74٫48 | 486٫1/km2 | 1901 |
| Orotina | Orotina | Alajuela | 24٬217 | 20٬341 | +19٫1% | 145٫11 | 166٫9/km2 | 1908 |
| San Carlos | Quesada | Alajuela | 198٬742 | 163٬745 | +21٫4% | 3٬352٫14 | 59٫3/km2 | 1911 |
| Zarcero | Zarcero | Alajuela | 15٬153 | 12٬205 | +24٫2% | 157٫36 | 96٫3/km2 | 1915 |
| Sarchí | Sarchí Norte | Alajuela | 21٬562 | 18٬085 | +19٫2% | 136٫76 | 157٫7/km2 | 1949 |
| Upala | Upala | Alajuela | 57٬361 | 43٬953 | +30٫5% | 1٬592٫67 | 36�0/km2 | 1970 |
| Los Chiles | Los Chiles | Alajuela | 34٬701 | 23٬735 | +46٫2% | 1٬332٫71 | 26�0/km2 | 1970 |
| Guatuso | San Rafael | Alajuela | 18٬316 | 15٬508 | +18٫1% | 752٫83 | 24٫3/km2 | 1970 |
| Río Cuarto | Río Cuarto | Alajuela | 14٬418 | 11٬074 | +30٫2% | 254٫89 | 56٫6/km2 | 2017 |
| Cartago |
Cartago | Cartago | 165٬417 | 147٬898 | +11٫8% | 278٫66 | 593٫6/km2 | 1848 |
| Paraíso | Paraíso | Cartago | 65٬941 | 57٬743 | +14٫2% | 476٫99 | 138٫2/km2 | 1848 |
| La Unión | Tres Ríos | Cartago | 99٬539 | 99٬399 | +0٫1% | 44٫18 | 2٬253�0/km2 | 1848 |
| Jiménez | Juan Viñas | Cartago | 18٬710 | 14٬669 | +27٫5% | 250٫07 | 74٫8/km2 | 1903 |
| Turrialba | Turrialba | Cartago | 82٬065 | 69٬616 | +17٫9% | 1٬589٫25 | 51٫6/km2 | 1903 |
| Alvarado | Pacayas | Cartago | 17٬134 | 14٬312 | +19٫7% | 79٫18 | 216٫4/km2 | 1908 |
| Oreamuno | San Rafael | Cartago | 48٬911 | 45٬473 | +7٫6% | 202٫9 | 241٫1/km2 | 1914 |
| El Guarco | El Tejar | Cartago | 47٬375 | 41٬793 | +13٫4% | 172 | 275٫4/km2 | 1939 |
| Heredia |
Heredia | Heredia | 131٬901 | 123٬616 | +6٫7% | 283٫11 | 465٫9/km2 | 1848 |
| Barva | Barva | Heredia | 47٬699 | 40٬660 | +17٫3% | 56٫01 | 851٫6/km2 | 1848 |
| Santo Domingo | Santo Domingo | Heredia | 45٬932 | 40٬072 | +14٫6% | 25٫4 | 1٬808٫3/km2 | 1869 |
| Santa Bárbara | Santa Bárbara | Heredia | 39٬133 | 36٬243 | +8�0% | 52٫1 | 751٫1/km2 | 1882 |
| San Rafael | San Rafael | Heredia | 48٬848 | 45٬965 | +6٫3% | 48٫31 | 1٬011٫1/km2 | 1885 |
| San Isidro | San Isidro | Heredia | 22٬806 | 20٬633 | +10٫5% | 26٫67 | 855٫1/km2 | 1905 |
| Belén | San Antonio | Heredia | 23٬759 | 21٬633 | +9٫8% | 12٫38 | 1٬919٫1/km2 | 1907 |
| Flores | San Joaquín | Heredia | 22٬026 | 20٬037 | +9٫9% | 6٫75 | 3٬263٫1/km2 | 1915 |
| San Pablo | San Pablo | Heredia | 29٬860 | 27٬671 | +7٫9% | 8٫34 | 3٬580٫3/km2 | 1961 |
| Sarapiquí | Puerto Viejo | Heredia | 67٬153 | 57٬147 | +17٫5% | 2٬144٫38 | 31٫3/km2 | 1970 |
| Liberia |
Liberia | Guanacaste | 80٬130 | 62٬987 | +27٫2% | 1٬442٫17 | 55٫6/km2 | 1848 |
| Nicoya | Nicoya | Guanacaste | 66٬268 | 50٬825 | +30٫4% | 1٬337٫57 | 49٫5/km2 | 1848 |
| Santa Cruz | Santa Cruz | Guanacaste | 72٬366 | 55٬104 | +31٫3% | 1٬320٫81 | 54٫8/km2 | 1848 |
| Bagaces | Bagaces | Guanacaste | 23٬709 | 19٬536 | +21٫4% | 1٬277٫93 | 18٫6/km2 | 1848 |
| Carrillo | Filadelfia | Guanacaste | 48٬227 | 37٬122 | +29٫9% | 599٫01 | 80٫5/km2 | 1877 |
| Cañas | Cañas | Guanacaste | 31٬738 | 26٬201 | +21٫1% | 687٫05 | 46٫2/km2 | 1878 |
| Abangares | Las Juntas | Guanacaste | 22٬211 | 18٬039 | +23٫1% | 646٫02 | 34٫4/km2 | 1915 |
| Tilarán | Tilarán | Guanacaste | 21٬232 | 19٬640 | +8٫1% | 669٫23 | 31٫7/km2 | 1923 |
| Nandayure | Carmona | Guanacaste | 11٬874 | 11٬121 | +6٫8% | 568٫14 | 20٫9/km2 | 1961 |
| La Cruz | La Cruz | Guanacaste | 26٬829 | 19٬181 | +39٫9% | 1٬385٫38 | 19٫4/km2 | 1969 |
| Hojancha | Hojancha | Guanacaste | 8٬224 | 7٬197 | +14٫3% | 262٫99 | 31٫3/km2 | 1971 |
| Puntarenas |
Puntarenas | Puntarenas | 141٬697 | 115٬019 | +23٫2% | 1٬786٫9 | 79٫3/km2 | 1862 |
| Esparza | Esparza (Espíritu Santo district) | Puntarenas | 34٬808 | 28٬644 | +21٫5% | 217٫23 | 160٫2/km2 | 1848 |
| Buenos Aires | Buenos Aires | Puntarenas | 50٬562 | 45٬244 | +11٫8% | 2٬382٫94 | 21٫2/km2 | 1914 |
| Montes de Oro | Miramar | Puntarenas | 16٬395 | 12٬950 | +26٫6% | 247٫59 | 66٫2/km2 | 1915 |
| Osa | Puerto Cortés | Puntarenas | 36٬088 | 29٬433 | +22٫6% | 1٬932٫7 | 18٫7/km2 | 1940 |
| Quepos | Quepos | Puntarenas | 32٬416 | 26٬861 | +20٫7% | 557٫85 | 58٫1/km2 | 1948 |
| Golfito | Golfito | Puntarenas | 44٬086 | 39٬150 | +12٫6% | 1٬032٫32 | 42٫7/km2 | 1949 |
| Coto Brus | San Vito | Puntarenas | 46٬351 | 38٬453 | +20٫5% | 944٫24 | 49٫1/km2 | 1965 |
| Parrita | Parrita | Puntarenas | 20٬068 | 16٬115 | +24٫5% | 483٫22 | 41٫5/km2 | 1971 |
| Corredores | Ciudad Neily (Corredor district) | Puntarenas | 51٬023 | 41٬831 | +22�0% | 623٫61 | 81٫8/km2 | 1973 |
| Garabito | Jacó | Puntarenas | 26٬672 | 17٬229 | +54٫8% | 316٫01 | 84٫4/km2 | 1980 |
| Monteverde | Monteverde | Puntarenas | 5٬386 | 4٬155 | +29٫6% | 53٫47 | 100٫7/km2 | 2021 |
| Puerto Jiménez | Puerto Jiménez | Puntarenas | 10٬644 | 8٬789 | +21٫1% | 720٫43 | 14٫8/km2 | 2022 |
| Limón |
Limón | Limón | 116٬457 | 94٬415 | +23٫3% | 1٬769٫38 | 65٫8/km2 | 1909 |
| Pococí | Guápiles | Limón | 146٬320 | 125٬962 | +16٫2% | 2٬188٫25 | 66٫9/km2 | 1911 |
| Siquirres | Siquirres | Limón | 63٬765 | 56٬786 | +12٫3% | 855٫15 | 74٫6/km2 | 1969 |
| Talamanca | Bribrí (Bratsi district) | Limón | 48٬906 | 30٬712 | +59٫2% | 2٬792٫23 | 17٫5/km2 | 1911 |
| Matina | Matina | Limón | 45٬329 | 37٬721 | +20٫2% | 770٫4 | 58٫8/km2 | 1969 |
| Guácimo | Guácimo | Limón | 49٬606 | 41٬266 | +20٫2% | 801٫56 | 61٫9/km2 | 1971 |
| Costa Rica | 5٬044٬197 | 4٬301٬712 | +17٫3% | 51٬170٫45[ب] | 98٫6/km2 |
انظر أيضاً
Notes
- ^ أ ب ت The Eleventh Population Census (2022) experienced significant issues, including problems stemming from the COVID-19 pandemic, resulting in only successfully sampling around 60% of homes and estimates having to be used.
- ^ Not including Cocos Island's land area.
المراجع
- ^ Comisión Nacional de División Territorial Administrativa (1980). Estudio sobre la División Territorial Administrativa de la Republica de Costa Rica [Study on the Administrative Territorial Division of the Republic of Costa Rica] (in الإسبانية). Costa Rica: Imprenta Nacional. §53.
- ^ أ ب ت Instituto Nacional de Estadística y Censos (July 2023). Estimación de Población y Vivienda 2022: Resultados Generales [2022 Population and Housing Estimate: General Results] (PDF) (in الإسبانية). San José, Costa Rica. ISBN 978-9930-525-75-3.
{{cite book}}: CS1 maint: location missing publisher (link) - ^ Legislative Assembly of the Republic of Costa Rica (2022-06-21). "Ley N° 10195 - Creación del Cantón de Puerto Jiménez, Cantón Décimo Tercero de la Provincia de Puntarenas" [Law № 10195 - Creation of the Canton of Puerto Jiménez, Thirteenth Canton of the Province of Puntarenas]. Sistema Costarricense de Información Jurídica (in الإسبانية). Archived from the original on 2024-04-22. Retrieved 2024-04-21.
- ^ أ ب Instituto Nacional de Estadística y Censos (2023). "Resultados Estimacion de Poblacion y Vivienda 2022" [2022 Population and Housing Estimate Results] (XLSX) (in الإسبانية). Archived from the original on 2024-06-04. Retrieved 2024-04-21.
- ^ أ ب Instituto Geográfico Nacional de Costa Rica (2024-06-20). "DIVISIÓN TERRITORIAL ADMINISTRATIVA, 2024 - TOTALES DE PROVINCIAS, CANTONES Y DISTRITOS DE COSTA RICA" [ADMINISTRATIVE TERRITORIAL DIVISION, 2024 - TOTALS OF PROVINCES, CANTONS AND DISTRICTS OF COSTA RICA] (PDF) (in الإسبانية). Retrieved 2024-07-16.
- ^ أ ب Alfaro and Zeledón (2006). Derechos ciudadanos y el gobierno local en Costa Rica [Rights of citizens and local governments in Costa Rica] (in الإسبانية). San José: Lara Segura & Asoc. p. 35.
- ^ Alfaro and Zeledón (2006). Derechos ciudadanos y el gobierno local en Costa Rica [Rights of citizens and local governments in Costa Rica] (in الإسبانية). San José: Lara Segura & Asoc. pp. 36–37.
- ^ "El Elector" [The Elector] (PDF) (in الإسبانية). Tribunal Supremo de Elecciones. May 2011. Archived from the original (PDF) on 2013-01-20. Retrieved January 16, 2016.
- ^ Unidad de Información y Adiestramiento (1987). La Municipalidad y sus funciones [The Municipality and its functions] (in الإسبانية). San José. §6.
{{cite book}}: CS1 maint: location missing publisher (link) - ^ Unidad de Información y Adiestramiento (1987). La Municipalidad y sus funciones [The Municipality and its functions] (in الإسبانية). San José. §11.
{{cite book}}: CS1 maint: location missing publisher (link) - ^ أ ب "Division Territorial Administrativa de Costa Rica" (in الإسبانية). Sistema Costarricense de Informacion Juridica. September 2, 2009. Archived from the original on April 4, 2023. Retrieved May 3, 2020.
- ^ "Población total por zona y sexo, según provincia, cantón y distrito" [Total population by area and sex, province, county and district] (in الإسبانية). Instituto Nacional de Estadística y Censos. 2011. Archived from the original (XLS) on March 5, 2016. Retrieved December 23, 2015.
- ^ "Division Territorial Administrativa de Costa Rica" [Administrative Territorial Divisions of Costa Rica] (PDF) (in الإسبانية). Instituto Nacional de Estadística y Censos. 2009. Archived from the original (PDF) on August 2, 2015. Retrieved December 30, 2015.

قالب:Articles on second-level administrative divisions of North American countries
- CS1 الإسبانية-language sources (es)
- CS1 maint: location missing publisher
- Short description with empty Wikidata description
- Articles containing إسپانية-language text
- Pages with empty portal template
- Cantons of Costa Rica
- Subdivisions of Costa Rica
- Lists of administrative divisions
- Administrative divisions in North America
- Second-level administrative divisions by country
- Costa Rica geography-related lists
- Lists of cities by country