كلفة شمسية
.jpg&filetimestamp=20250501193451&)


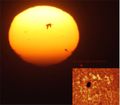
- Top: active region 2192 in 2014 containing the largest sunspot of solar cycle 24[1] and active region 1302 in September 2011.
- Middle: sunspot close-up in the visible spectrum (left) and another sunspot in UV, taken by the TRACE observatory.
- Bottom: a large group of sunspots stretching about 320،000 km (200،000 mi) across.
| جزء من سلسلة مقالات عن |
| الفيزياء الشمسية |
|---|
 |
الكلفة الشمسية Sunspot هي منطقة على سطح الشمس -الكرة الضوئية- تتميز بدرجة حرارة أخفض من المناطق المحيطة بها وبنشاط مغناطيسي مكثف الذي يمنع حمل الحرارة مكونا مناطق ذات حرارة سطحية منخفضة. وبالرغم من كونها مناطق شديدة السطعان إلا أن الفرق بين درجة حرارتها، التي تبلغ حوالي 4000-4500 كيلفن، وحرارة المناطق المحيطة بها، 5700 كيلفن، تجعلها تظهر كبقع مظلمة. ولو نظر إلى هذه البقع بمعزل عن الكرة الضوئية المحيطة لبدت أكثر سطوعا من المصباح القوسي. ومن المتوقع في عام 2007 م أن تبلغ الكلف الشمسية حدا أدنى ضمن دورة الكلف الشمسية [1].

كـَلَف الشمس مساحات داكنة نوعًا ما على سطح الشمس. تبدو داكنة لأنها أبرد من أجزاء سطح الشمس الأخرى المرئية. وقد تصل درجة حرارتها إلى نحو 4,000°م مقارنة بـ 6,000°م للمنطقة المحيطة بها، لذلك تُعطي ضوءًا أقل.
ويصل قطر الكَلَفة الكبيرة إلى 32,000 كم، أي أكبر من قطر الأرض عدة مرات. وقد تستمر لعدة أشهر. وتتكون الكَلَفة الكبيرة من مركز داكن يُسَمَّى الظل الكامل، ومنطقة محيطة به ذات لون فاتح تسمَّى الظل المشعشع. وتسمى كلفة الشمس الصغيرة الحدقة وليست لها منطقة شبه ظل. وقد يصل قطر الحدقة إلى مئات الكيلومترات وتستمر لمدة ساعات فقط.
تفاوت البقع الشمسية
ويختلف عدد كلف الشمس وخطوط العرض الشمسية التي تظهر فيها عبر مدة تُقَدَّر بحوالي 11 عامًا. وتُسَمَّى هذه الفترة دورة كَلَف الشمس. وفي بداية الدورة يظهر كَلَف الشمس أساسًا بين خطي عرض 20° و40° شمالي وجنوبي خط استواء الشمس، ثم يزداد عدد الكَلَف وتحدث بالقرب من خط استواء الشمس. وعندما يصل عددها إلى الحد الأقصى فإنها تطوف بين خطي عرض 5° و40° شمالي وجنوبي خط استواء الشمس. وفي نهاية الدورة يقل عدد الكَلَف إلى أقل عدد ممكن. ويحدث الكَلَف أكثر بين خطي عرض 5° و15° شمالاً وجنوبًا.
كيف يتكون كَلَف الشمس
لكَلَف الشمس مجال مغنطيسي تصل قوته إلى 3000 ضعف معدل المجال المغنطيسي للشمس أو الأرض. ويعتقد الفلكيون أن تكوين الكَلَف له علاقة وطيدة بهذه الحقيقة. وحسب التفسير العام المقبول فإن مجال الشمس المغنطيسي القوي له شكل الأنابيب تحت سطح الشمس مباشرة. وتدور الشمس بسرعة أكثر عند خط استوائها منه عند أقطابها؛ ولذلك تتمدد الأنابيب المغنطيسية، وعندها تنشأ خيوط عبر الأنابيب المغنطيسية وتندفع نحو سطح الشمس.
يظهر زوجان من كلف الشمس في أي منطقة تنفذ منها الخيوط التي تخرج وتعود إلى السطح مرة أخرى. وخلال 11 عامًا تندفع الخيوط أولاً عبر سطح الشمس عند خطوط عرض مرتفعة ولاحقًا عند خطوط عرض منخفضة، وهذا التغيير يفسـِّر اختلافات عرض الكلف الشمسي خلال فترة الدورة الكَلَفية.
ولزوج كَلَف الشمس أقطاب مغنطيسية متنافرة، كأقطاب المغنطيس، وتسَمَّى النقطتان الكَلَفة السابقة والكَلَفة اللاحقة، لأن واحدة تقود للأخرى في اتجاه دوران الشمس. وفي خلال الفترة، أي 11 سنة من مدار كَلَف الشمس، تكون الأقطاب المغنطيسية لزوج كَلَف الشمس شمالي خط استواء الشمس متنافرة مع أقطاب زوج الكَلَف في جنوبي خط استواء الشمس. فمثلاً إذا كانت الكَلَفة السابقة في النصف الشمالي تتصرف كطرف مغنطيسي باحث شمالي، فإن الكلفة السابقة في النصف الجنوبي تتصرف كطرف مغنطيسي باحث جنوبي. ومع ذلك فإنه في الدورة التالية لكلف الشمس يكون سلوك الكلفة السابق معكوسًا، وتستمر دورة الكلف الشمسي التامة لمدة 22 عامًا.
علاقة القوة المغناطيسية بانخفاض درجة حرارة البقع الشمسية
تمنع القوة المغناطيسية والتي تكون خطوط مغناطيسية من دخول الماجما شديدة الحرارة من دخول المنطقة مما يجعل الماجما داخل المنطقة ابرد . وايضاً القوة المغناطيسية القوية تمنع تدفق الغازات ذات الحرارة الشديدة القادمة من داخل الشمس ان تصعد إلى السطح مما يؤدي إلى برود هذا السطع فتضهر البقع الشمسية.
- من الممكن ان تحتوي الشمس على مئات البقع الشمسية في فترات ، ومن الممكن ان لاتحتوي على ايٍ منها خلال فترات اخرى. وذالك عائدُ إلى ان البقع الشمسية لها دوراة تظهر من خلالها وهذه الدورات تحدث خلال 11 سنة فعلا سبيل المثال خلال السنة الاولى لا تحتوي الشمس على اي بقع وبعد خمس سنوات ونصف سوف تحتوي الشمس على اعلى عدد من البقع وبعد خمس سنوات ونصف سوف لن تحتوي الشمس على اي بقعة .
التاريخ

إشارات من الواضح أنها لبقع شمسية قام بها الفلكيون الصينيون في 28 ق.م. (هانشو، 27)، الذي ربما كان بإمكانه مشاهدة أكبر مجموعات من البقع الشمسية عندما قامت العواصف الترابية بدور المصفاة لوهج الشمس في صحاري آسيا الوسطى. كما شوهدت بقعة شمسية كبيرة وقت وفاة شارلمان في 813 م. وفي 17 مارس 807 رصد الراهب البندكتي آدلموس بقعة شمسية كبيرة، ظلت ماثلة للعيان لمدة ثمانية أيام. وقد ظن آدلموس أنه يرى عبور عطارد.[2] Sunspot activity in 1129 was described by جون من ووستر. ابن رشد كذلك أعطى وصفاً للبقع الشمسية في القرن 12.[3] إلا أن هذه المشاهدات المبكرة قد أسيء تفسيرها حتى أعطاها گاليليو التفسير الصحيح في 1612.
اكتشف الفلكيون أن دورة كَلَف الشمس هي جزء من دورة النشاط الشمسي التي تشتمل على لهب شمسي. وترتبط مثل هذه الظاهرة كثيرًا بكَلَف الشمس، وتحدث في المنطقة المحيطة بالكَلَف.
في أوائل القرن العشرين أثبت العالم البريطاني والتر موندير نظريًا أنه لم تحدث أي ظاهرة لكَلَف الشمس في الفترة من عام 1645 - 1715م. وأثبتت البحوث التي أُجريت في السبعينيات من القرن العشرين، عدم حدوث كَلَف شمس خلال السبعين عامًا المذكورة. وتسمَّى هذه الفترة بفترة موندير، وهي تشير إلى أن دورة الكَلَف الشمسي قد لا تكون أساسية للشمس، كما يعتقد علماء الفلك.
وفي السبعينيات بدأ عدد كبير من العُلماء في الاعتقاد بأن النشاط الشمسي قد يكون له أثر مباشر على طقس الأرض، وقد تكشف الدراسات عما إذا كان طقس الأرض قد تأثر بما يجري في الشمس من نشاط لدورة كَلَف الشمس الواحدة، أو بالاختلافات الشمسية التي تحدث عبر مدة طويلة من الزمن. وأطلقت الولايات المتحدة الأمريكية عام 1980م، قمر أبحاث صناعيًا سُمِّي البعثة الشمسية الكبرى وذلك في قمة نشاط كَلَفة الشمس. وأوضحت البعثة أن الانخفاض في كمية الطاقة الشمسية التي تصل الأرض تتناسب مع مساحة الشمس المغطاة بالكَلَف الشمسي. حدثت ظاهرة قمة الكلف الشمسي لآخر مرة بين عامي 1989 و 1991م، ثم تكررت مرة أخرى بين عامي 2000 و 2001م.
الفيزياء
Morphology
_2007-04-30_T001456.gif&filetimestamp=20250501193450&)
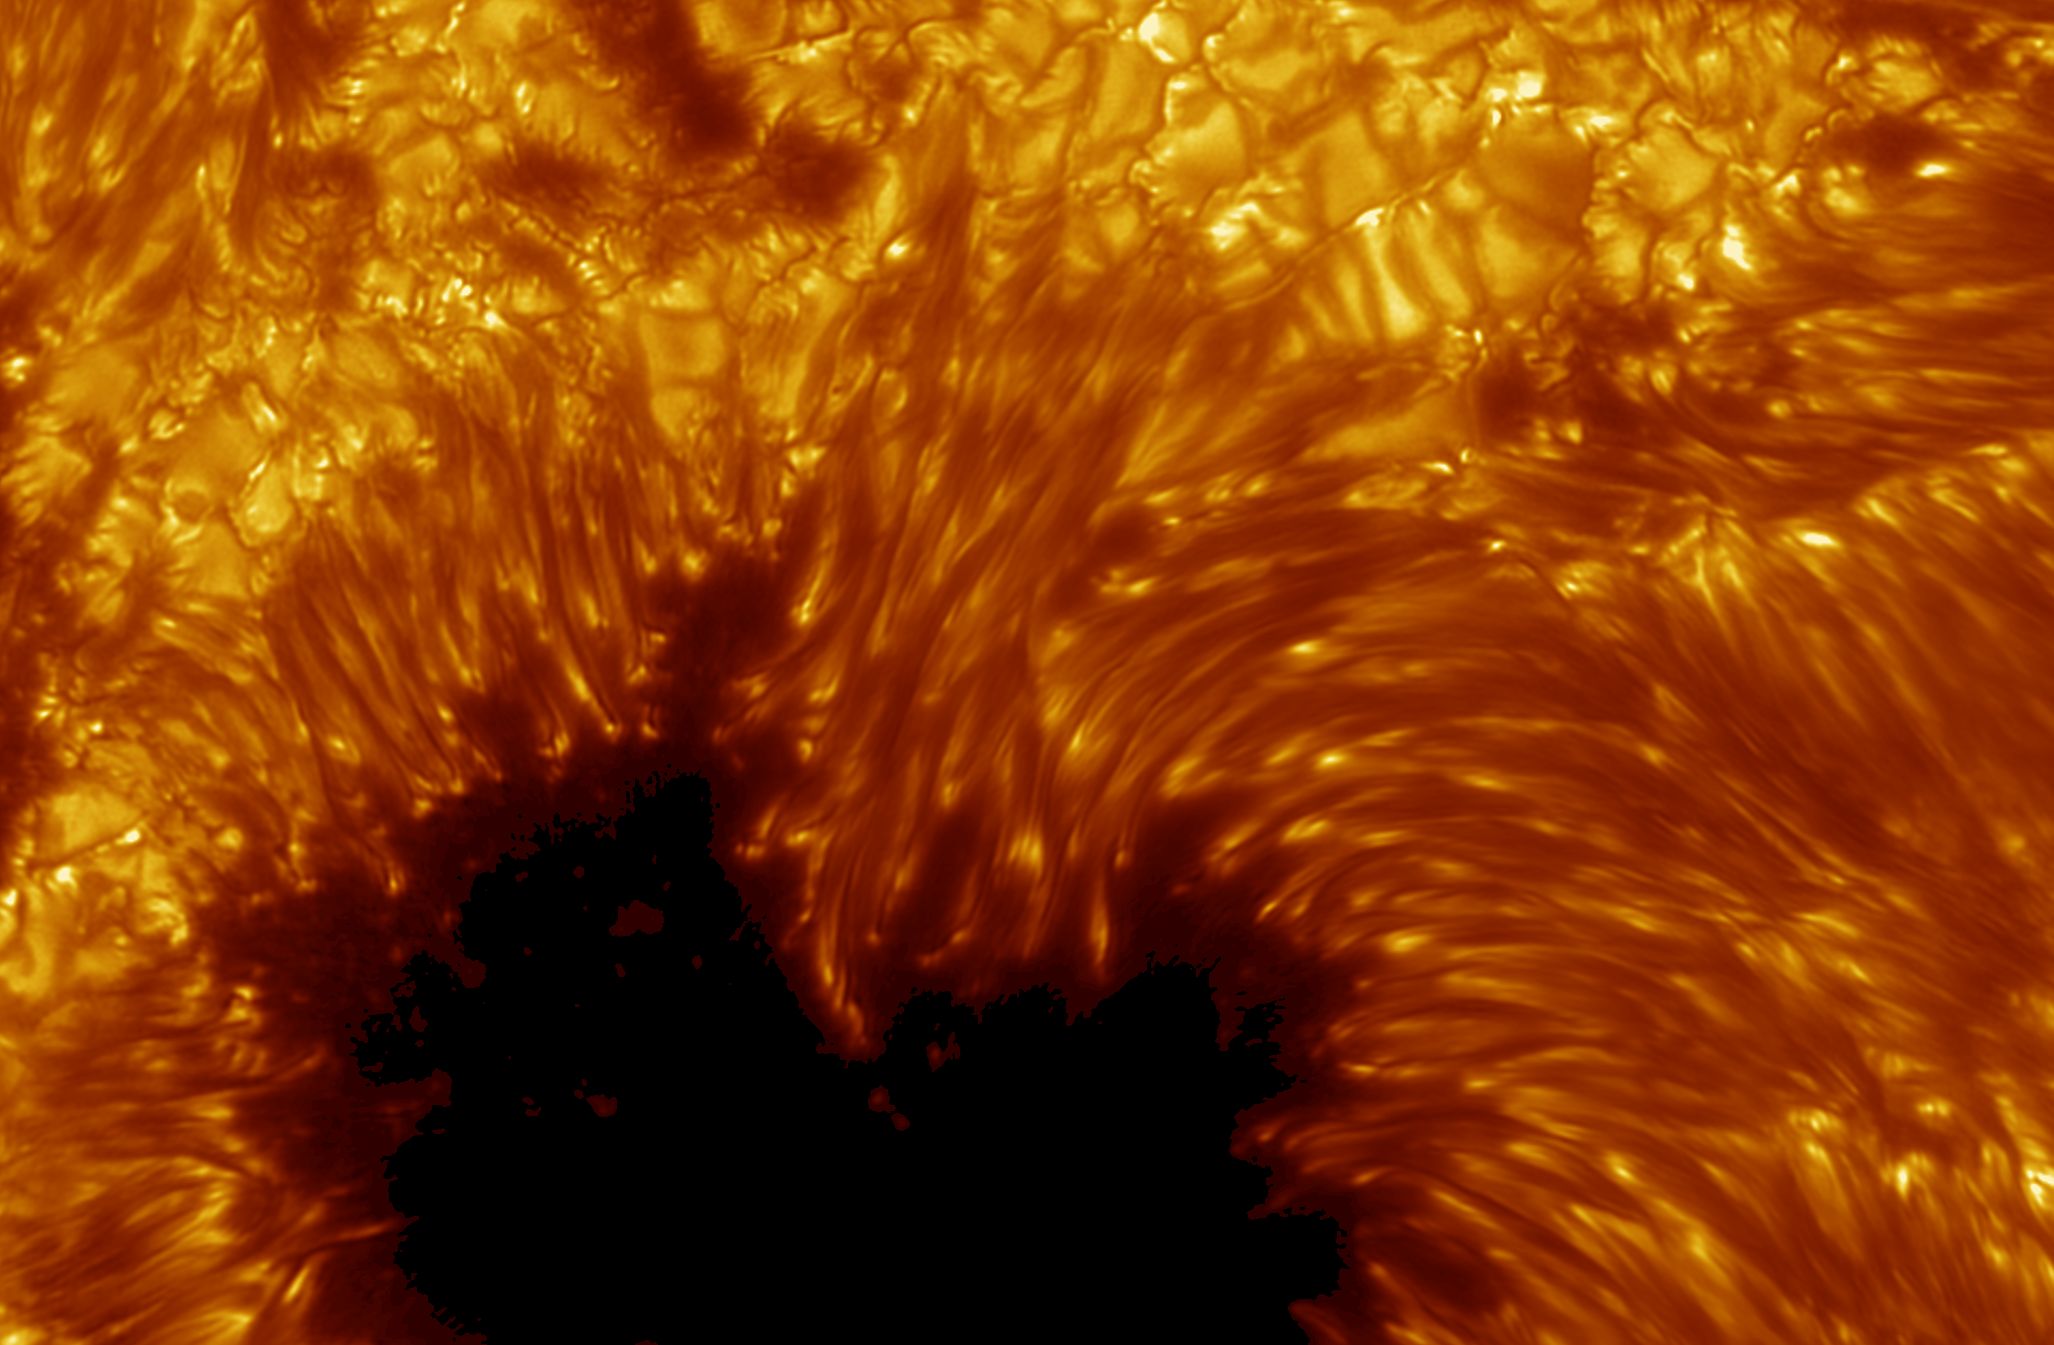
Sunspots have two main structures: a central umbra and a surrounding penumbra. The umbra is the darkest region of a sunspot and is where the magnetic field is strongest and approximately vertical, or normal, to the Sun's surface, or photosphere. The umbra may be surrounded completely or only partially by a brighter region known as the penumbra.[5] The penumbra is composed of radially elongated structures known as penumbral filaments and has a more inclined magnetic field than the umbra.[6] Within sunspot groups, multiple umbrae may be surrounded by a single, continuous penumbra.
The temperature of the umbra is roughly 3000–4500 K, in contrast to the surrounding material at about 5780 K, leaving sunspots clearly visible as dark spots. This is because the luminance of a heated black body (closely approximated by the photosphere) at these temperatures varies greatly with temperature. Isolated from the surrounding photosphere, a single sunspot would shine brighter than the full moon, with a crimson-orange color.[7]
In some forming and decaying sunspots, relatively narrow regions of bright material appear penetrating into or completely dividing an umbra. These formations, referred to as light bridges, have been found to have a weaker, more tilted magnetic field compared to the umbra at the same height in the photosphere. Higher in the photosphere, the light bridge magnetic field merges and becomes comparable to that of the umbra. Gas pressure in light bridges has also been found to dominate over magnetic pressure, and convective motions have been detected.[4]
The Wilson effect implies that sunspots are depressions on the Sun's surface.
Lifecycle
The appearance of an individual sunspot may last anywhere from a few days to a few months, though groups of sunspots and their associated active regions tend to last weeks or months. Sunspots expand and contract as they move across the surface of the Sun, with diameters ranging from 16 km (10 mi)[8] to 160،000 km (100،000 mi).[9]
Formation
Although the details of sunspot formation are still a matter of ongoing research, it is widely understood that they are the visible manifestations of magnetic flux tubes in the Sun's convective zone projecting through the photosphere within active regions.[10] Their characteristic darkening occurs due to this strong magnetic field inhibiting convection in the photosphere. As a result, the energy flux from the Sun's interior decreases, and with it, surface temperature, causing the surface area through which the magnetic field passes to look dark against the bright background of photospheric granules.
Sunspots initially appear in the photosphere as small darkened spots lacking a penumbra. These structures are known as solar pores.[11] Over time, these pores increase in size and move towards one another. When a pore gets large enough, typically around 3،500 km (2،000 mi) in diameter, a penumbra will begin to form.[10]
Decay
Magnetic pressure should tend to remove field concentrations, causing the sunspots to disperse, but sunspot lifetimes are measured in days to weeks. In 2001, observations from the Solar and Heliospheric Observatory (SOHO) using sound waves traveling below the photosphere (local helioseismology) were used to develop a three-dimensional image of the internal structure below sunspots; these observations show that a powerful downdraft lies beneath each sunspot, forms a rotating vortex that sustains the concentrated magnetic field.[12]
Solar cycle

Solar cycles last typically about eleven years, varying from just under 10 to just over 12 years. Over the solar cycle, sunspot populations increase quickly and then decrease more slowly. The point of highest sunspot activity during a cycle is known as solar maximum, and the point of lowest activity as solar minimum. This period is also observed in most other solar activity and is linked to a variation in the solar magnetic field that changes polarity with this period.
Early in the cycle, sunspots appear at higher latitudes and then move towards the equator as the cycle approaches maximum, following Spörer's law. Spots from two sequential cycles co-exist for several years during the years near solar minimum. Spots from sequential cycles can be distinguished by direction of their magnetic field and their latitude.
The Wolf number sunspot index counts the average number of sunspots and groups of sunspots during specific intervals. The 11-year solar cycles are numbered sequentially, starting with the observations made in the 1750s.[13]
George Ellery Hale first linked magnetic fields and sunspots in 1908.[14] Hale suggested that the sunspot cycle period is 22 years, covering two periods of increased and decreased sunspot numbers, accompanied by polar reversals of the solar magnetic dipole field. Horace W. Babcock later proposed a qualitative model for the dynamics of the solar outer layers. The Babcock Model explains that magnetic fields cause the behavior described by Spörer's law, as well as other effects, which are twisted by the Sun's rotation.
Longer-period trends
Sunspot numbers also change over long periods. For example, during the period known as the modern maximum from 1900 to 1958 the solar maxima trend of sunspot count was upwards; for the following 60 years the trend was mostly downwards.[15] Overall, the Sun was last as active as the modern maximum over 8,000 years ago.[16]
Sunspot number is correlated with the intensity of solar radiation over the period since 1979, when satellite measurements became available. The variation caused by the sunspot cycle to solar output is on the order of 0.1% of the solar constant (a peak-to-trough range of 1.3 W·m−2 compared with 1366 W·m−2 for the average solar constant).[17][18]


الرصد الحديث

Sunspots are observed with land-based and Earth-orbiting solar telescopes. These telescopes use filtration and projection techniques for direct observation, in addition to various types of filtered cameras. Specialized tools such as spectroscopes and spectrohelioscopes are used to examine sunspots and sunspot areas. Artificial eclipses allow viewing of the circumference of the Sun as sunspots rotate through the horizon.
Since looking directly at the Sun with the naked eye permanently damages human vision, amateur observation of sunspots is generally conducted using projected images, or directly through protective filters. Small sections of very dark filter glass, such as a #14 welder's glass, are effective. A telescope eyepiece can project the image, without filtration, onto a white screen where it can be viewed indirectly, and even traced, to follow sunspot evolution. Special purpose hydrogen-alpha narrow bandpass filters and aluminum-coated glass attenuation filters (which have the appearance of mirrors due to their extremely high optical density) on the front of a telescope provide safe observation through the eyepiece.
تطبيقات
Due to their correlation with other kinds of solar activity, sunspots can be used to help predict space weather, the state of the ionosphere, and conditions relevant to short-wave radio propagation or satellite communications. High sunspot activity is celebrated by members of the amateur radio community as a harbinger of excellent ionospheric propagation conditions that greatly increase radio range in the HF bands. During peaks in sunspot activity, worldwide radio communication can be achieved on frequencies as high as the 6-meter VHF band.[20]
Solar activity (and the solar cycle) have been implicated as a factor in global warming. The first possible example of this is the Maunder Minimum period of low sunspot activity which occurred during the Little Ice Age in Europe.[21] However, detailed studies from multiple paleoclimate indicators show that the lower northern hemisphere temperatures in the Little Ice Age began while sunspot numbers were still high before the start of the Maunder Minimum, and persisted until after the Maunder Minimum had ceased. Numerical climate modelling indicates that volcanic activity was the main driver of the Little Ice Age.[22]
Sunspots themselves, in terms of the magnitude of their radiant-energy deficit, have a weak effect on solar flux.[23] The total effect of sunspots and other magnetic processes in the solar photosphere is an increase of roughly 0.1% in brightness of the Sun in comparison with its brightness at the solar-minimum level. This is a difference in total solar irradiance at Earth over the sunspot cycle of close to . Other magnetic phenomena which correlate with sunspot activity include faculae and the chromospheric network.[24] The combination of these magnetic factors mean that the relationship of sunspot numbers to Total Solar Irradiance (TSI) over the decadal-scale solar cycle, and their relationship for century timescales, need not be the same. The main problem with quantifying the longer-term trends in TSI lies in the stability of the absolute radiometry measurements made from space, which has improved in recent decades but remains a problem.[25][26] Analysis shows that it is possible that TSI was actually higher in the Maunder Minimum compared to present-day levels, but uncertainties are high, with best estimates in the range with a uncertainty range of .[27]


Sunspots, with their intense magnetic field concentrations, facilitate the complex transfer of energy and momentum to the upper solar atmosphere. This transfer occurs through a variety of mechanisms, including generated waves in the lower solar atmosphere[28] and magnetic reconnection events.[29]
كلفة نجمية
In 1947, G. E. Kron proposed that starspots were the reason for periodic changes in brightness on red dwarfs.[30] Since the mid-1990s, starspot observations have been made using increasingly powerful techniques yielding more and more detail: photometry showed starspot growth and decay and showed cyclic behavior similar to the Sun's; spectroscopy examined the structure of starspot regions by analyzing variations in spectral line splitting due to the Zeeman effect; Doppler imaging showed differential rotation of spots for several stars and distributions different from the Sun's; spectral line analysis measured the temperature range of spots and the stellar surfaces. For example, in 1999, Strassmeier reported the largest cool starspot ever seen rotating the giant K0 star XX Trianguli (HD 12545) with a temperature of 3،500 K (3،230 °C), together with a warm spot of 4،800 K (4،530 °C).[30][31]
معرض صور
البقعة الشمسية 923 عند الغروب وفي ضوء الشمس
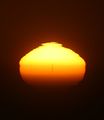
سراب فائق في الغروب للبقعة الشمسية #930

الغروب في بنگلادش، يناير 2004


انظر أيضاً
- قانون جوي
- قائمة الدورات الشمسية
- دورة شمسية
- دوران شمسي
- طقس الفضاء
- Hale's law – empirical law for the orientation of magnetic fields in solar active regions
- Joy's law – empirical law for the distribution of sunspots in solar active regions
- Letters on Sunspots
- List of solar cycles
- Radio propagation
- Solar cycle
- Solar rotation
- Space weather
- Spörer's law (predictive)
- Starspot
- Wolf number sunspot number
الهامش
- ^ "Gentle giant sunspot region 2192".
- ^ Wilson, E. R. "A Few Pre-Copernican Astronomers". Popular Astronomy. 25: 93.
- ^ عيد, حامد أ. "ابن رشد كفيزيائي Averroes As A Physician". جامعة القاهرة.
- ^ أ ب Felipe, T.; Collados, M.; Khomenko, E.; Kuckein, C.; Asensio Ramos, A.; Balthasar, H.; Berkefeld, T.; Denker, C.; Feller, A.; Franz, M.; Hofmann, A.; Joshi, J.; Kiess, C.; Lagg, A.; Nicklas, H.; Orozco Suárez, D.; Pastor Yabar, A.; Rezaei, R.; Schlichenmaier, R.; Schmidt, D.; Schmidt, W.; Sigwarth, M.; Sobotka, M.; Solanki, S. K.; Soltau, D.; Staude, J.; Strassmeier, K. G.; Volkmer, R.; von der Lühe, O.; Waldmann, T. (December 2016). "Three-dimensional structure of a sunspot light bridge" (PDF). Astronomy & Astrophysics. 596: A59. arXiv:1611.04803. Bibcode:2016A&A...596A..59F. doi:10.1051/0004-6361/201629586. S2CID 119419693. Retrieved 5 January 2022.
- ^ Schlichenmaier, R.; Rezaei, R.; Bello González, N.; Waldmann, T. A. (March 2010). "The formation of a sunspot penumbra". Astronomy and Astrophysics. 512: L1. Bibcode:2010A&A...512L...1S. doi:10.1051/0004-6361/201014112.
- ^ Mathew, S. K.; Lagg, A.; Solanki, S. K.; Collados, M.; Borrero, J. M.; Berdyugina, S.; Krupp, N.; Woch, J.; Frutiger, C. (November 2003). "Three dimensional structure of a regular sunspot from the inversion of IR Stokes profiles". Astronomy & Astrophysics. 410 (2): 695–710. Bibcode:2003A&A...410..695M. doi:10.1051/0004-6361:20031282.
- ^ "Sunspots". NASA. 1 April 1998. Archived from the original on 3 April 2013. Retrieved 22 February 2013.
- ^ خطأ استشهاد: وسم
<ref>غير صحيح؛ لا نص تم توفيره للمراجع المسماةnascom - ^ خطأ استشهاد: وسم
<ref>غير صحيح؛ لا نص تم توفيره للمراجع المسماةhowstuffworks - ^ أ ب Solanki, Sami K. (1 April 2003). "Sunspots: An overview". Astronomy and Astrophysics Review. 11 (2–3): 153–286. Bibcode:2003A&ARv..11..153S. doi:10.1007/s00159-003-0018-4. S2CID 120721248.
- ^ Sobotka, Michal; Vazquez, Manuel; Bonet, Jose Antonio; Hanslmeier, Arnold; Hirzberger, Johann (20 January 1999). "Temporal Evolution of Fine Structures in and around Solar Pores" (PDF). The Astrophysical Journal. 511 (1): 436–450. Bibcode:1999ApJ...511..436S. doi:10.1086/306671. S2CID 121691780. Retrieved 5 January 2022.
- ^ NASA News Release (6 November 2001). "SOHO reveals how sunspots take stranglehold on the Sun". SpaceFlight Now. Archived from the original on 17 January 2015. Retrieved 9 March 2013.
- ^ Tribble, A. (2003). The Space Environment, Implications for Spacecraft Design. Princeton University Press. pp. 15–18.
- ^ Hale, G. E. (1908). "On the Probable Existence of a Magnetic Field in Sun-Spots". The Astrophysical Journal. 28: 315. Bibcode:1908ApJ....28..315H. doi:10.1086/141602.
- ^ "Sunspot index graphics". Solar Influences Data Analysis Center. Retrieved 27 September 2007.
- ^ Solanki SK; Usoskin IG; Kromer B; Schüssler M; et al. (October 2004). "Unusual activity of the Sun during recent decades compared to the previous 11,000 years". Nature. 431 (7012): 1084–1087. Bibcode:2004Natur.431.1084S. doi:10.1038/nature02995. PMID 15510145. S2CID 4373732.
- ^ "Solar Forcing of Climate". Climate Change 2001: Working Group I: The Scientific Basis. Archived from the original on 15 March 2005. Retrieved 2005-03-10.
- ^ Weart, Spencer (2006). Weart, Spencer (ed.). "The Discovery of Global Warming – Changing Sun, Changing Climate?". American Institute of Physics. Archived from the original on 17 June 2006. Retrieved 2007-04-14.
- ^ Le Mouël, Jean-Louis; Shnirman, Mikhail G.; Blanter, Elena M. (2007-12-01). "The 27-Day Signal in Sunspot Number Series and the Solar Dynamo". Solar Physics (in الإنجليزية). 246 (2): 295–307. Bibcode:2007SoPh..246..295L. doi:10.1007/s11207-007-9065-8. ISSN 1573-093X.
- ^ Stu Turner. "Sunspots and Propagation". Ham Radio School.com. Archived from the original on 26 June 2017. Retrieved 5 January 2020.
- ^ Eddy J.A. (June 1976). "The Maunder Minimum". Science. 192 (4245): 1189–1202. Bibcode:1976Sci...192.1189E. doi:10.1126/science.192.4245.1189. PMID 17771739. S2CID 33896851. PDF Copy Archived 16 فبراير 2010 at the Wayback Machine
- ^ Owens, M.J.; et al. (October 2017). "The Maunder Minimum and the Little Ice Age: An update from recent reconstructions and climate simulations". J. Space Weather and Space Climate (in الإنجليزية). 7: A25. arXiv:1708.04904. doi:10.1051/swsc/2017019. ISSN 2115-7251. S2CID 37433045.
- ^ Hudson H (2008). "Solar activity". Scholarpedia. 3 (3): 3967. Bibcode:2008SchpJ...3.3967H. doi:10.4249/scholarpedia.3967.
- ^ Willson, R. C.; Gulkis, S.; Janssen, M.; Hudson, H. S.; Chapman, G. A. (1981). "Observations of solar irradiance variability". Science. 211 (4483): 700–702. Bibcode:1981Sci...211..700W. doi:10.1126/science.211.4483.700. PMID 17776650.
- ^ Kopp, G. (April 2014). "An assessment of the solar irradiance record for climate studies". J. Space Weather and Space Climate (in الإنجليزية). 4: A14. Bibcode:2014JSWSC...4A..14K. doi:10.1051/swsc/2014012.
- ^ Kopp, G. (July 2016). "Magnitudes and timescales of total solar irradiance variability". J. Space Weather and Space Climate (in الإنجليزية). 6: A30. arXiv:1606.05258. Bibcode:2016JSWSC...6A..30K. doi:10.1051/swsc/2016025. S2CID 55902879.
- ^ Lockwood, M.; Ball, W. (May 2020). "Placing limits on long-term variations in quiet-Sun irradiance and their contribution to total solar irradiance and solar radiative forcing of climate". Proceedings of the Royal Society A (in الإنجليزية). 476 (2238): 20200077. Bibcode:2020RSPSA.47600077L. doi:10.1098/rspa.2020.0077. ISSN 1364-5021. PMC 7428030. PMID 32831591.
- ^ Jess, D. B., Jafarzadeh, S., Keys, P. H., Stangalini, M., Verth, G., Grant, S. D. T. (19 January 2023). "Waves in the lower solar atmosphere: the dawn of next-generation solar telescopes". Living Reviews in Solar Physics. Springer Nature. 20 (1). arXiv:2212.09788. Bibcode:2023LRSP...20....1J. doi:10.1007/s41116-022-00035-6.
- ^ Shibata, K., Magara, T. (15 December 2011). "Solar Flares: Magnetohydrodynamic Processes". Living Reviews in Solar Physics. Springer International Publishing. 8 (1): 6. Bibcode:2011LRSP....8....6S. doi:10.12942/lrsp-2011-6. hdl:2433/153022.
- ^ أ ب خطأ استشهاد: وسم
<ref>غير صحيح؛ لا نص تم توفيره للمراجع المسماةstrassmeier - ^ "Derived images showing rotation of cool and warm starspots". Leibniz Institute for Astrophysics. Archived from the original on 29 May 2010. Retrieved 2013-01-14.
المصادر
وصلات خارجية
- عاصفة شمسية تهدد الاتصالات - موقع إسلام أون لاين.نت
| كلفة شمسية
]].- Solar Cycle 24 and VHF Aurora Website (www.solarcycle24.com)
- Belgium World Data Center for the sunspot index
- High resolution sunspot image
- Sunspot images in high-res Impressive collection of sunspot images
- http://www.tvweather.com/awpage/history_of_the_atmosphere.htm
- NOAA Solar Cycle Progression: Current solar cycle.
- Current conditions: Space weather
- Lockheed Martin Solar and Astrophysics Lab
- Sun|trek website An educational resource for teachers and students about the Sun and its effect on the Earth
- Tools to display the current sunspot number in a browser
- The Sharpest View of the Sun
- Daily Sunspot Update and Picture of the Sun (www.spaceweather.com)
- Animated explanation of Sunspots in the Photosphere (University of Glamorgan)
بيانات البقع الشمسية
- "11,000 Year Sunspot Number Reconstruction". Global Change Master Directory. Retrieved 11 March 2005.
{{cite web}}: Unknown parameter|dateformat=ignored (help)- "Unusual activity of the Sun during recent decades compared to the previous 11,000 years". WDC for Paleoclimatology. Retrieved 11 March 2005.
{{cite web}}: Unknown parameter|dateformat=ignored (help)
- "Unusual activity of the Sun during recent decades compared to the previous 11,000 years". WDC for Paleoclimatology. Retrieved 11 March 2005.
- "Sunspot Numbers from Ancient Times to Present from NOAA/NGDC". Global Change Master Directory. Retrieved 11 March 2005.
{{cite web}}: Unknown parameter|dateformat=ignored (help)- "SUNSPOT NUMBERS". NOAA NGDC Solar Data Services. Retrieved 11 March 2005.
{{cite web}}: Unknown parameter|dateformat=ignored (help)- International Sunspot Number—sunspot maximum and minimum 1610–present; annual numbers 1700–present; monthly numbers 1749–present; daily values 1818–present; and sunspot numbers by north and south hemisphere. The McNish-Lincoln sunspot prediction is also included.
- American sunspot numbers 1944–present
- Ancient sunspot data 165 BC to 1684 AD
- Group Sunspot Numbers (Doug Hoyt re-evaluation) 1610-1995
- "SUNSPOT NUMBERS". NOAA NGDC Solar Data Services. Retrieved 11 March 2005.

_2007-04-30_T001456.gif&filetimestamp=20250501193450)