مقاطعة يوبا، كاليفورنيا
مقاطعة يوبا
County of Yuba | |
|---|---|
.jpg&filetimestamp=20250303150703&) .jpg&filetimestamp=20250303150701&)  | |
 الشعار | |
 Interactive map of Yuba County | |
 الموقع في ولاية كاليفورنيا | |
| البلد | United States |
| الولاية | كاليفورنيا |
| المقاطعة | مقاطعة يوبا |
| CSA | Sacramento–Arden-Arcade–Yuba City |
| Incorporated | February 18, 1850[1] |
| السمِيْ | نهر يوبا |
| مقر المقاطعة | Marysville |
| أكبر تجمع | Linda (population) Loma Rica (area) Marysville (incorporated) |
| الحكومة | |
| • النوع | Council–Administrator |
| • Chair | Gary Bradford |
| • Vice Chair | Jon Messick |
| • Board of Supervisors | Supervisors[2]
|
| • مدير المقاطعة | Kevin Mallen |
| المساحة | |
| • الإجمالي | 644 ميل² (1٬670 كم²) |
| • البر | 632 ميل² (1٬640 كم²) |
| • الماء | 12 ميل² (30 كم²) |
| أعلى منسوب | 4٬828 ft (1٬472 m) |
| التعداد (2020) | |
| • الإجمالي | 81٬575 |
| • الكثافة | 130/sq mi (49/km2) |
| GDP | |
| • الإجمالي | 3.768 مليار دولار (2022) |
| منطقة التوقيت | UTC-8 (Pacific Time Zone) |
| • الصيف (التوقيت الصيفي) | UTC-7 (Pacific Daylight Time) |
| Congressional districts | 1st, 3rd |
| الموقع الإلكتروني | www |
مقاطعة يوبا (إنگليزية: Yuba County؛ /ˈjuːbə/ (![]() استمع); Maidu: Yubu)[5][6] هي مقاطعة تقع في شمال وسط الوادي الأوسط، كاليفورنيا في الولايات المتحدة. As of the 2020 U.S. Census, its population was 81,575.[7] Yuba County is included in the Yuba City metropolitan statistical area, which is also included in the Sacramento–Roseville combined statistical area. The county is in the Central Valley region along the Feather River; the county seat is Marysville.[8]
استمع); Maidu: Yubu)[5][6] هي مقاطعة تقع في شمال وسط الوادي الأوسط، كاليفورنيا في الولايات المتحدة. As of the 2020 U.S. Census, its population was 81,575.[7] Yuba County is included in the Yuba City metropolitan statistical area, which is also included in the Sacramento–Roseville combined statistical area. The county is in the Central Valley region along the Feather River; the county seat is Marysville.[8]
التاريخ
Yuba County was one of California's original counties, formed in 1850 at the time of statehood. Parts of the county's territory were given to Placer County in 1851, to Nevada County in 1851, and to Sierra County in 1852.
The county was named after the Yuba River by Captain John Sutter for the Maidu village Yubu, Yupu, or Juba near the confluence of the Yuba and Feather Rivers. General Mariano Vallejo said the river was named Uba by an exploring expedition in 1824 because of the quantities of wild grapes (uvas silvestres in Spanish) that they found growing on its banks.
الجغرافيا
According to the U.S. Census Bureau, the county has an area of 644 ميل مربع (1،670 km2), of which 12 ميل مربع (31 km2) (1.9%) are covered by water.[9] It is California's fifth-smallest county by area. The county lies along the western slope of the Sierra Nevada, the steep slopes making it prime territory for the siting of hydroelectric power plants.
Part of the county, where Marysville (the county seat) and most of the population lives, is west of the mountains on the valley floor; a great deal of agricultural business occurs in this part of the county, especially fruit orchards, rice fields, and cattle ranching.[10]
البيئة
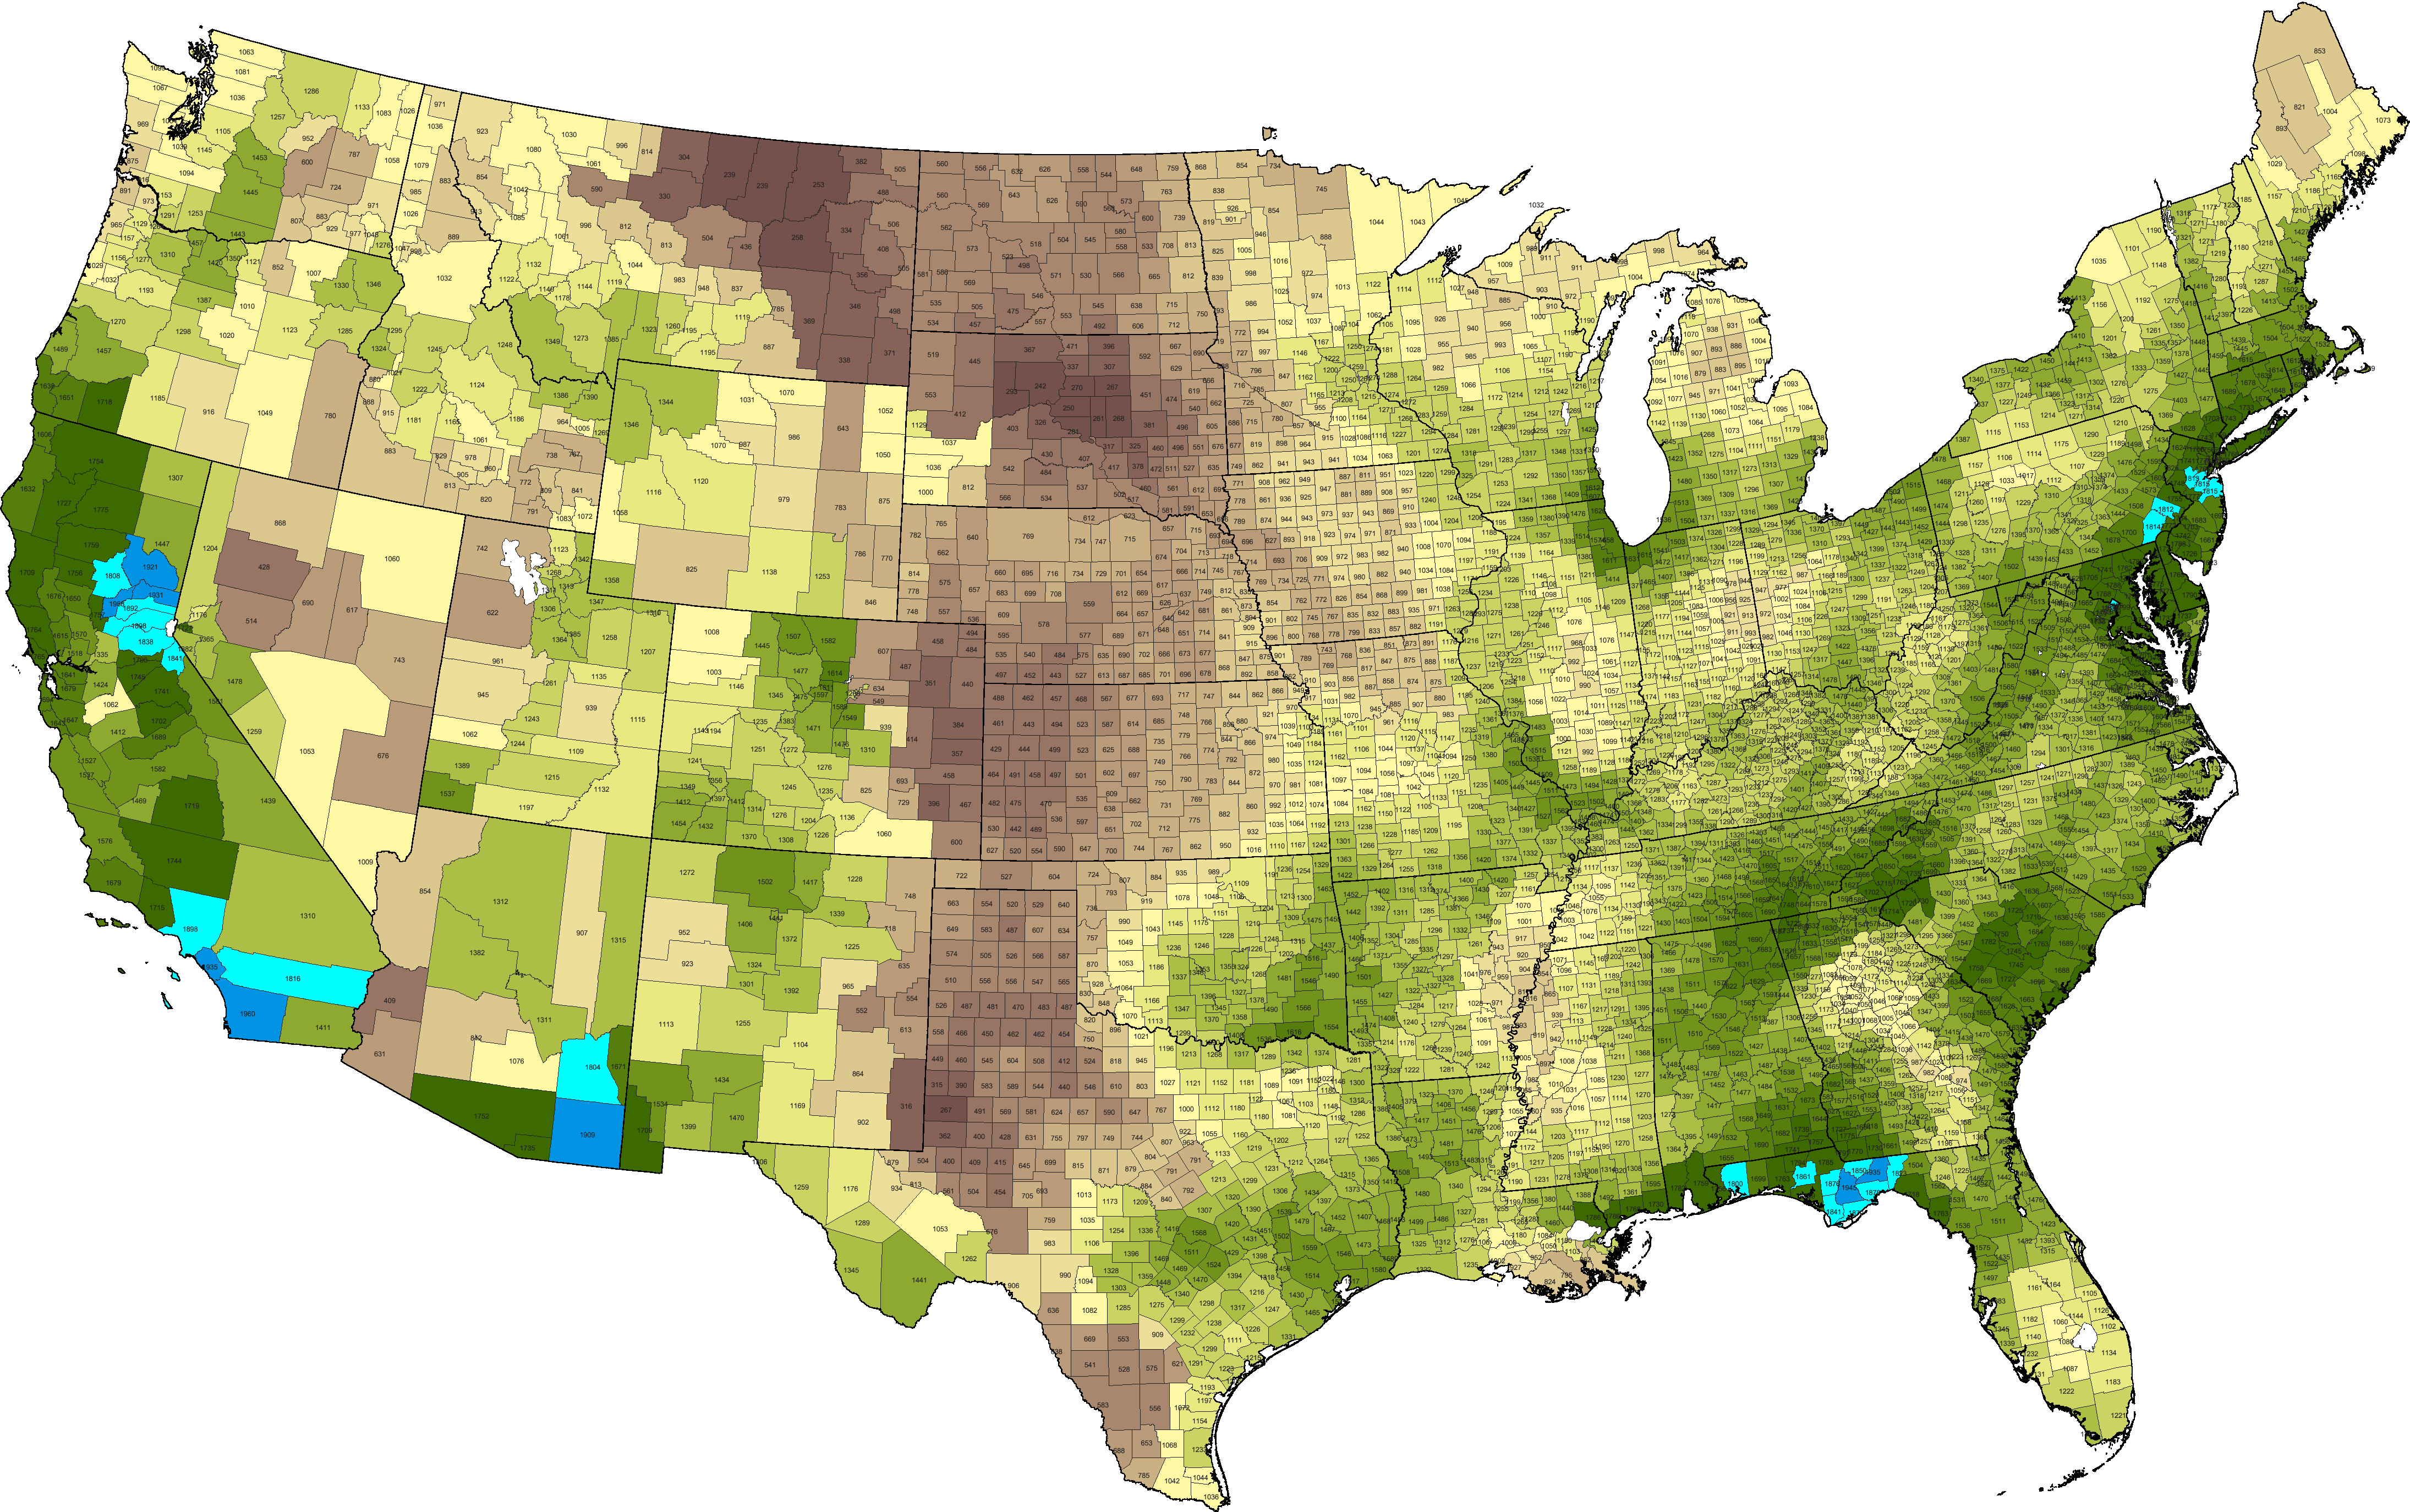
Yuba is the most biodiverse county in the contiguous United States, with a documented 1,968 native vascular plant species per 10،000 متر كيلومربع (3،860 sq mi),[11] and 2,772 total species verifiably observed.[12] Flowering plant species include the yellow mariposa lily (Calochortus luteus).[13]
National protected areas in Yuba County include parts of the Plumas National Forest and the Tahoe National Forest. The county also has natural areas consisting of forests, grasslands, riparian areas, and meadows.[citation needed]
المقاطعات المجاورة
- Butte County to the north
- Sierra County to the northeast
- Nevada County to the east
- Placer County to the southeast
- Sutter County to the southwest
الجريمة
This table includes the number of incidents reported and the rate per 1,000 persons for each type of offense:
| التعداد ومعدلات الجريمة | ||
|---|---|---|
| Population[14] | 71,817 | |
| Violent crime[15] | 279 | 3.88 |
| Homicide[15] | 3 | 0.04 |
| Forcible rape[15] | 24 | 0.33 |
| Robbery[15] | 46 | 0.64 |
| Aggravated assault[15] | 206 | 2.87 |
| Property crime[15] | 883 | 12.30 |
| Burglary[15] | 455 | 6.34 |
| Larceny-theft[15][note 1] | 836 | 11.64 |
| Motor vehicle theft[15] | 208 | 2.90 |
| Arson[15] | 21 | 0.29 |
Cities by population and crime rates
| Cities by population and crime rates | ||||||||
|---|---|---|---|---|---|---|---|---|
| City | Population[16] | Violent crimes[16] | Violent crime rate per 1,000 persons |
Property crimes[16] | Property crime rate per 1,000 persons | |||
| Marysville | 12,254 | 88 | 7.18 | 502 | 40.97 | |||
| Wheatland | 3,509 | 2 | 0.57 | 36 | 10.26 | |||
السياسة
إحصائيات تسجيل الناخبين
| Population and registered voters | ||
|---|---|---|
| Total population[14] | 71,817 | |
| Registered voters[17][note 2] | 29,044 | 40.4% |
| Democratic[17] | 9,139 | 31.5% |
| Republican[17] | 11,402 | 39.3% |
| Democratic–Republican spread[17] | -2,263 | -7.8% |
| Independent[17] | 1,346 | 4.6% |
| Green[17] | 139 | 0.5% |
| Libertarian[17] | 220 | 0.8% |
| Peace and Freedom[17] | 110 | 0.4% |
| Americans Elect[17] | 2 | 0.0% |
| Other[17] | 28 | 0.1% |
| No party preference[17] | 6,658 | 22.9% |
Cities by population and voter registration
| Cities by population and voter registration | |||||||
|---|---|---|---|---|---|---|---|
| City | Population[14] | Registered voters[17] [note 2] |
Democratic[17] | Republican[17] | D–R spread[17] | Other[17] | No party preference[17] |
| Marysville | 12,248 | 38.9% | 35.0% | 37.9% | -2.9% | 9.6% | 21.4% |
| Wheatland | 3,381 | 47.0% | 25.5% | 48.2% | -22.7% | 11.3% | 19.9% |
استعراض عام
Yuba is a strongly Republican county in presidential and congressional elections. The last Democratic presidential nominee to win a majority in the county was Jimmy Carter in 1976.
| السنة | الجمهوري | الديمقراطي | حزب ثالث | |||
|---|---|---|---|---|---|---|
| رقم. | % | رقم. | % | رقم. | % | |
| 2024 | 18,491 | 61٫49% | 10,725 | 35٫66% | 856 | 2٫85% |
| 2020 | 17,676 | 59٫32% | 11,230 | 37٫69% | 890 | 2٫99% |
| 2016 | 13,170 | 57٫27% | 7,910 | 34٫39% | 1,918 | 8٫34% |
| 2012 | 11,275 | 57٫06% | 7,711 | 39٫02% | 775 | 3٫92% |
| 2008 | 12,007 | 56٫10% | 8,866 | 41٫43% | 528 | 2٫47% |
| 2004 | 12,076 | 67�00% | 5,687 | 31٫55% | 261 | 1٫45% |
| 2000 | 9,838 | 61�00% | 5,546 | 34٫39% | 743 | 4٫61% |
| 1996 | 7,971 | 51٫53% | 5,789 | 37٫42% | 1,710 | 11٫05% |
| 1992 | 7,333 | 43٫40% | 5,785 | 34٫24% | 3,777 | 22٫36% |
| 1988 | 8,937 | 61٫37% | 5,444 | 37٫38% | 182 | 1٫25% |
| 1984 | 9,780 | 63٫52% | 5,339 | 34٫68% | 278 | 1٫81% |
| 1980 | 7,942 | 56٫28% | 4,896 | 34٫70% | 1,273 | 9٫02% |
| 1976 | 5,496 | 44٫74% | 6,451 | 52٫51% | 338 | 2٫75% |
| 1972 | 6,623 | 56٫95% | 4,435 | 38٫13% | 572 | 4٫92% |
| 1968 | 5,371 | 48٫17% | 4,461 | 40٫01% | 1,318 | 11٫82% |
| 1964 | 4,964 | 42٫29% | 6,766 | 57٫64% | 9 | 0٫08% |
| 1960 | 5,293 | 51٫72% | 4,882 | 47٫71% | 58 | 0٫57% |
| 1956 | 4,782 | 55٫76% | 3,767 | 43٫92% | 27 | 0٫31% |
| 1952 | 5,840 | 60٫42% | 3,762 | 38٫92% | 63 | 0٫65% |
| 1948 | 3,403 | 46٫85% | 3,608 | 49٫68% | 252 | 3٫47% |
| 1944 | 2,379 | 42٫14% | 3,254 | 57٫63% | 13 | 0٫23% |
| 1940 | 2,471 | 34٫24% | 4,660 | 64٫57% | 86 | 1٫19% |
| 1936 | 1,332 | 23٫95% | 4,125 | 74٫18% | 104 | 1٫87% |
| 1932 | 1,176 | 26٫17% | 3,138 | 69٫84% | 179 | 3٫98% |
| 1928 | 2,022 | 50٫02% | 1,990 | 49٫23% | 30 | 0٫74% |
| 1924 | 1,735 | 45٫88% | 426 | 11٫26% | 1,621 | 42٫86% |
| 1920 | 2,012 | 70٫70% | 696 | 24٫46% | 138 | 4٫85% |
| 1916 | 1,530 | 42٫10% | 1,980 | 54٫49% | 124 | 3٫41% |
| 1912 | 17 | 0٫65% | 1,242 | 47٫57% | 1,352 | 51٫78% |
| 1908 | 1,270 | 55٫24% | 902 | 39٫23% | 127 | 5٫52% |
| 1904 | 1,235 | 63٫37% | 633 | 32٫48% | 81 | 4٫16% |
| 1900 | 1,179 | 54٫08% | 971 | 44٫54% | 30 | 1٫38% |
| 1896 | 1,204 | 53٫82% | 991 | 44٫30% | 42 | 1٫88% |
| 1892 | 1,079 | 45٫41% | 1,198 | 50٫42% | 99 | 4٫17% |
| 1888 | 1,130 | 46٫37% | 1,170 | 48٫01% | 137 | 5٫62% |
| 1884 | 1,214 | 52٫55% | 1,047 | 45٫32% | 49 | 2٫12% |
| 1880 | 1,165 | 49٫43% | 1,185 | 50٫28% | 7 | 0٫30% |
In the United States House of Representatives, Yuba County is split between California's 1st congressional district, represented by قالب:Representative/format/pfl, and California's 3rd congressional district, represented by قالب:Representative/format/pfl.
In the California State Legislature, the county is in the 4 Senate District, represented by Republican Jim Nielsen,[19] and the 3rd Assembly District, represented by Republican James Gallagher.
النقل
Major highways
Public transportation
Yuba Sutter Transit operates local bus service, as well as commuter runs to downtown Sacramento. Greyhound buses stop in Marysville.
المطارات
Yuba County Airport is 3 ميل (4.8 km) south of Marysville. It is a general-aviation airport.
Brownsville Aero Pines Airport is off La Porte Rd in Brownsville.
السكان
| التعداد | Pop. | ملاحظة | %± |
|---|---|---|---|
| 1850 | 9٬673 | — | |
| 1860 | 13٬668 | 41٫3% | |
| 1870 | 10٬851 | −20٫6% | |
| 1880 | 11٬284 | 4�0% | |
| 1890 | 9٬636 | −14٫6% | |
| 1900 | 8٬620 | −10٫5% | |
| 1910 | 10٬042 | 16٫5% | |
| 1920 | 10٬375 | 3٫3% | |
| 1930 | 11٬331 | 9٫2% | |
| 1940 | 17٬034 | 50٫3% | |
| 1950 | 24٬420 | 43٫4% | |
| 1960 | 33٬859 | 38٫7% | |
| 1970 | 44٬736 | 32٫1% | |
| 1980 | 49٬733 | 11٫2% | |
| 1990 | 58٬228 | 17٫1% | |
| 2000 | 60٬219 | 3٫4% | |
| 2010 | 72٬155 | 19٫8% | |
| 2020 | 81٬575 | 13٫1% | |
| 2023 (تق.) | 85٬722 | [20] | 5٫1% |
| U.S. Decennial Census[21] 1790–1960[22] 1900–1990[23] 1990–2000[24] 2010[25] 2020[26] | |||
تعداد 2020
| Race / Ethnicity (NH = Non-Hispanic) | Pop 2000[27] | Pop 2010[25] | Pop 2020[26] | % 2000 | % 2010 | % 2020 |
|---|---|---|---|---|---|---|
| White alone (NH) | 39,320 | 42,416 | 41,750 | 65.30% | 58.78% | 51.18% |
| Black or African American alone (NH) | 1,795 | 2,122 | 2,831 | 2.98% | 2.94% | 3.47% |
| Native American or Alaska Native alone (NH) | 1,306 | 1,260 | 1,034 | 2.17% | 1.75% | 1.27% |
| Asian alone (NH) | 4,480 | 4,710 | 5,583 | 7.44% | 6.53% | 6.84% |
| Pacific Islander alone (NH) | 98 | 270 | 372 | 0.16% | 0.37% | 0.46% |
| Other race alone (NH) | 120 | 102 | 459 | 0.20% | 0.14% | 0.56% |
| Mixed race or Multi-racial (NH) | 2,651 | 3,224 | 6,026 | 4.40% | 4.47% | 7.39% |
| Hispanic or Latino (any race) | 10,449 | 18,051 | 23,520 | 17.35% | 25.02% | 28.83% |
| Total | 60,219 | 72,155 | 81,575 | 100.00% | 100.00% | 100.00% |
2011
| Population, race, and income | |||||
|---|---|---|---|---|---|
| Total population[14] | 71,817 | ||||
| White[14] | 50,090 | 69.7% | |||
| Black or African American[14] | 1,879 | 2.6% | |||
| American Indian or Alaska Native[14] | 1,403 | 2.0% | |||
| Asian[14] | 5,030 | 7.0% | |||
| Native Hawaiian or other Pacific Islander[14] | 225 | 0.3% | |||
| Some other race[14] | 8,260 | 11.5% | |||
| Two or more races[14] | 4,930 | 6.9% | |||
| Hispanic or Latino (of any race)[28] | 17,687 | 24.6% | |||
| Per capita income[29] | $20,046 | ||||
| Median household income[30] | $46,617 | ||||
| Median family income[31] | $52,775 | ||||
أماكن حسب التعداد والعرق والدخل
| أماكن حسب التعداد والعرق | ||||||||
|---|---|---|---|---|---|---|---|---|
| المكان | Type[32] | Population[14] | White[14] | Other[14] [note 4] |
Asian[14] | Black or African American[14] |
Native American[14] [note 5] |
Hispanic or Latino (of any race)[28] |
| Beale AFB | CDP | 1,818 | 65.6% | 26.7% | 5.2% | 1.9% | 0.7% | 18.1% |
| Camptonville | CDP | 139 | 97.1% | 2.9% | 0.0% | 0.0% | 0.0% | 9.4% |
| Challenge-Brownsville | CDP | 1,479 | 81.9% | 10.0% | 0.0% | 3.4% | 4.7% | 8.2% |
| Dobbins | CDP | 280 | 66.8% | 33.2% | 0.0% | 0.0% | 0.0% | 42.1% |
| Linda | CDP | 17,883 | 61.9% | 22.7% | 11.1% | 1.4% | 2.8% | 32.3% |
| Loma Rica | CDP | 2,648 | 86.1% | 12.6% | 1.3% | 0.0% | 0.0% | 8.3% |
| Marysville | City | 12,248 | 71.1% | 15.7% | 6.1% | 5.7% | 1.3% | 26.9% |
| Olivehurst | CDP | 13,817 | 64.3% | 26.7% | 5.2% | 0.8% | 3.0% | 34.7% |
| Plumas Lake | CDP | 5,834 | 69.6% | 13.5% | 8.5% | 7.3% | 1.1% | 14.4% |
| Smartsville | CDP | 196 | 99.0% | 1.0% | 0.0% | 0.0% | 0.0% | 1.5% |
| Wheatland | City | 3,381 | 63.6% | 24.8% | 5.8% | 4.1% | 1.7% | 23.0% |
| Places by population and income | |||||
|---|---|---|---|---|---|
| Place | Type[32] | Population[33] | Per capita income[29] | Median household income[30] | Median family income[31] |
| Beale AFB | CDP | 1,818 | $15,997 | $43,125 | $41,711 |
| Camptonville | CDP | 139 | $15,094 | $17,188 | $21,563 |
| Challenge-Brownsville | CDP | 1,479 | $21,300 | $56,538 | $57,788 |
| Dobbins | CDP | 280 | $35,295 | $76,434 | $76,176 |
| Linda | CDP | 17,883 | $14,768 | $39,583 | $43,540 |
| Loma Rica | CDP | 2,648 | $27,058 | $71,838 | $84,957 |
| Marysville | City | 12,248 | $19,070 | $37,836 | $40,440 |
| Olivehurst | CDP | 13,817 | $14,496 | $37,488 | $40,374 |
| Plumas Lake | CDP | 5,834 | $27,848 | $84,350 | $87,636 |
| Smartsville | CDP | 196 | $18,461 | $50,156 | $40,167 |
| Wheatland | City | 3,381 | $21,852 | $60,679 | $63,699 |
2010
The 2010 United States census reported that Yuba County had a population of 72,155. The racial makeup of Yuba County was 49,332 (68.4%) White, 2,361 (3.3%) African American, 1,675 (2.3%) Native American, 4,862 (6.7%) Asian, 293 (0.4%) Pacific Islander, 8,545 (11.8%) from other races, and 5,087 (7.1%) from two or more races. Hispanics or Latinos of any race were 18,051 persons (25.0%).[34]
| Population reported at 2010 United States census | |||||||||
|---|---|---|---|---|---|---|---|---|---|
| The County | Total Population |
White | African American |
Native American |
Asian | Pacific Islander |
other races |
two or more races |
Hispanic or Latino (of any race) |
| Yuba County | 72,155 | 49,332 | 2,361 | 1,675 | 4,862 | 293 | 8,545 | 5,087 | 18,051 |
| Incorporated cities |
Total Population |
White | African American |
Native American |
Asian | Pacific Islander |
other races |
two or more races |
Hispanic or Latino (of any race) |
| Marysville | 12,072 | 8,576 | 522 | 298 | 498 | 38 | 1,247 | 893 | 2,920 |
| Wheatland | 3,456 | 2,633 | 41 | 58 | 203 | 5 | 278 | 238 | 620 |
| Census-designated places |
Total Population |
White | African American |
Native American |
Asian | Pacific Islander |
other races |
two or more races |
Hispanic or Latino (of any race) |
| Beale AFB | 1,319 | 949 | 117 | 32 | 45 | 8 | 50 | 118 | 191 |
| Camptonville | 158 | 117 | 0 | 15 | 2 | 0 | 4 | 20 | 5 |
| Challenge-Brownsville | 1,148 | 1,006 | 10 | 31 | 5 | 3 | 10 | 83 | 90 |
| Dobbins | 624 | 517 | 5 | 52 | 6 | 0 | 9 | 35 | 28 |
| Linda | 17,773 | 9,973 | 722 | 361 | 2,304 | 80 | 3,029 | 1,304 | 5,779 |
| Loma Rica | 2,368 | 2,085 | 20 | 60 | 20 | 2 | 52 | 129 | 211 |
| Olivehurst | 13,656 | 8,534 | 322 | 399 | 772 | 61 | 2,623 | 945 | 4,994 |
| Plumas Lake | 5,853 | 3,923 | 372 | 73 | 474 | 44 | 451 | 516 | 1,312 |
| Smartsville | 177 | 157 | 0 | 5 | 0 | 0 | 9 | 6 | 18 |
| Other unincorporated areas |
Total Population |
White | African American |
Native American |
Asian | Pacific Islander |
other races |
two or more races |
Hispanic or Latino (of any race) |
| All others not CDPs (combined) | 13,551 | 10,862 | 230 | 291 | 533 | 52 | 783 | 800 | 1,883 |
2000
As of the census[35] of 2000, 60,219 people, 20,535 households, and 14,805 families resided in the county. The population density was 96 inhabitants per square mile (37/km2). The 22,636 housing units had an average density of 36 لكل ميل مربع ([convert: unit mismatch]). The racial makeup of the county was 70.6% White, 3.2% African American, 2.6% Native American, 7.5% Asian, 0.2% Pacific Islander, 10.0% from other races, and 5.9% from two or more races. About 17.4% of the population were Hispanics or Latinos of any race. Ancestry distribution was 11.2% German, 10.4% American, 7.6% Irish, and 7.5% English according to Census 2000; 78.8% spoke English, 13.2% Spanish, and 4.7% Hmong as their first language.
Of the 20,535 households, 38.1% had children under living with them, 53.2% were married couples living together, 13.3% had a female householder with no husband present, and 27.9% were not families. About 21.7% of all households were made up of individuals, and 8.2% had someone living alone who was 65 or older. The average household size was 2.87, and the average family size was 3.34.
In the county, the age distribution was 31.0% under 18, 10.7% from 18 to 24, 28.0% from 25 to 44, 19.6% from 45 to 64, and 10.6% who were 65 or older. The median age was 31 years. For every 100 females, there were 101.6 males. For every 100 females 18 and over, there were 99.4 males.
The median income for a household in the county was $30,460, and for a family was $34,103. Males had a median income of $27,845 versus $21,301 for females. The per capita income for the county was $14,124. About 16.3% of families and 20.8% of the population were below the poverty line, including 27.6% of those under age 18 and 7.8% of those age 65 or over.
التعليم
Higher education is available at Yuba Community College. The county also has a Yuba County Library system with one branch in Marysville.
Yuba County schools have a 16% suspension rate, with 2,257 students receiving suspensions out of 14,027 students enrolled in Yuba County schools.[36]
التجمعات
Cities
- Marysville (county seat)
- Wheatland
Census-designated places
Other unincorporated communities
البلدات المهجورة
ترتيب التعداد
The population ranking of the following table is based on the 2010 census of Yuba County.[37]
| Rank | City/Town/etc. | Municipal type | Population (2010 Census) |
|---|---|---|---|
| 1 | Linda | CDP | 17,773 |
| 2 | Olivehurst | CDP | 13,656 |
| 3 | Marysville (county seat) | City | 12,072 |
| 4 | Plumas Lake | CDP | 5,853 |
| 5 | Wheatland | City | 3,456 |
| 6 | Loma Rica | CDP | 2,368 |
| 7 | Beale Air Force Base | CDP | 1,319 |
| 8 | Challenge-Brownsville | CDP | 1,148 |
| 9 | Dobbins | CDP | 624 |
| 10 | Smartsville | CDP | 177 |
| 11 | Camptonville | CDP | 158 |
انظر أيضاً
- Hiking trails in Yuba County[dead link]
- National Register of Historic Places listings in Yuba County, California
- Yuba County Five
الهامش
- ^ Only larceny-theft cases involving property over $400 in value are reported as property crimes.
- ^ أ ب Percentage of registered voters with respect to total population. Percentages of party members with respect to registered voters follow.
- ^ This total comprised 1,132 votes for Progressive Theodore Roosevelt (who was official Republican nominee in California), 186 votes for Socialist Eugene V. Debs and 34 votes for Prohibition Party nominee Eugene W. Chafin.
- ^ Other = Some other race + Two or more races
- ^ Native American = Native Hawaiian or other Pacific Islander + American Indian or Alaska Native
المراجع
- محددة
- ^ "Chronology". California State Association of Counties. Retrieved February 6, 2015.
- ^ "Welcome to Yuba County, CA".
- ^ "Yuba County High Point". Peakbagger.com. Retrieved March 30, 2015.
- ^ "Gross Domestic Product: All Industries in Yuba County, CA". Federal Reserve Economic Data. Federal Reserve Bank of St. Louis.
- ^ Sutter County Museum - Sutter County Historical Society News Bulletin (Vol. XXXV No. 1)
- ^ 1500 California Place Names: Their Origin and Meaning
- ^ "Yuba County, California". United States Census Bureau. Retrieved January 30, 2022.
- ^ "Find a County". National Association of Counties. Retrieved June 7, 2011.
- ^ "US Gazetteer files: 2010, 2000, and 1990". United States Census Bureau. February 12, 2011. Retrieved April 23, 2011.
- ^ Caroline M. Olney. 1902
- ^ Biota of North America Program; County-centered estimates of the number of native species per 10000 km2 (data 2011)
- ^ "Observations, iNaturalist, Yuba County, CA, US". www.iNaturalist.org.
- ^ C. Michael Hogan. 2009. Yellow Mariposa Lily: Calochortus luteus, GlobalTwitcher.com, ed. N. Stromberg Archived أكتوبر 4, 2011 at the Wayback Machine
- ^ أ ب ت ث ج ح خ د ذ ر ز س ش ص ض ط ظ U.S. Census Bureau. American Community Survey, 2011 American Community Survey 5-Year Estimates, Table B02001. U.S. Census website. Retrieved October 26, 2013.
- ^ أ ب ت ث ج ح خ د ذ ر Office of the Attorney General, Department of Justice, State of California. Table 11: Crimes – 2009 Archived ديسمبر 2, 2013 at the Wayback Machine. Retrieved November 14, 2013.
- ^ أ ب ت United States Department of Justice, Federal Bureau of Investigation. Crime in the United States, 2012, Table 8 (California). Retrieved November 14, 2013.
- ^ أ ب ت ث ج ح خ د ذ ر ز س ش ص ض ط ظ California Secretary of State. February 10, 2013 - Report of Registration Archived يوليو 27, 2013 at the Wayback Machine. Retrieved October 31, 2013.
- ^ Leip, David. "Dave Leip's Atlas of U.S. Presidential Elections". uselectionatlas.org. Retrieved May 26, 2017.
- ^ "Communities of Interest — County". California Citizens Redistricting Commission. Archived from the original on October 23, 2015. Retrieved September 28, 2014.
- ^ "Annual Estimates of the Resident Population for Counties: April 1, 2020 to July 1, 2023". United States Census Bureau. Retrieved March 26, 2024.
- ^ "Census of Population and Housing from 1790-2000". US Census Bureau. Retrieved January 24, 2022.
- ^ "Historical Census Browser". University of Virginia Library. Retrieved May 31, 2014.
- ^ "Population of Counties by Decennial Census: 1900 to 1990". United States Census Bureau. Retrieved May 31, 2014.
- ^ "Census 2000 PHC-T-4. Ranking Tables for Counties: 1990 and 2000" (PDF). United States Census Bureau. Retrieved May 31, 2014.
- ^ أ ب "P2 Hispanic or Latino, and Not Hispanic or Latino by Race – 2010: DEC Redistricting Data (PL 94-171) – Yuba County, California". United States Census Bureau.
- ^ أ ب "P2 Hispanic or Latino, and Not Hispanic or Latino by Race – 2020: DEC Redistricting Data (PL 94-171) – Yuba County, California". United States Census Bureau.
- ^ "P004: Hispanic or Latino, and Not Hispanic or Latino by Race – 2000: DEC Summary File 1 – Yuba County, California". United States Census Bureau.
- ^ أ ب U.S. Census Bureau. American Community Survey, 2011 American Community Survey 5-Year Estimates, Table B03003. U.S. Census website. Retrieved October 26, 2013.
- ^ أ ب U.S. Census Bureau. American Community Survey, 2011 American Community Survey 5-Year Estimates, Table B19301. U.S. Census website. Retrieved October 21, 2013.
- ^ أ ب U.S. Census Bureau. American Community Survey, 2011 American Community Survey 5-Year Estimates, Table B19013. U.S. Census website. Retrieved October 21, 2013.
- ^ أ ب U.S. Census Bureau. American Community Survey, 2011 American Community Survey 5-Year Estimates, Table B19113. U.S. Census website. Retrieved October 21, 2013.
- ^ أ ب U.S. Census Bureau. American Community Survey, 2011 American Community Survey 5-Year Estimates. U.S. Census website. Retrieved October 21, 2013.
- ^ U.S. Census Bureau. American Community Survey, 2011 American Community Survey 5-Year Estimates, Table B01003. U.S. Census website. Retrieved October 21, 2013.
- ^ قالب:USCensus2010CA
- ^ "U.S. Census website". United States Census Bureau. Retrieved May 14, 2011.
- ^ "California State - Expulsion, Suspension, and Truancy Information for 2009-10". Retrieved June 25, 2011.
- ^ CNMP, US Census Bureau. "This site has been redesigned and relocated. - U.S. Census Bureau". www.census.gov.
- عمومية
- Caroline M. Olney (December 1902). "Mountains and Valleys of Yuba County". XL (6): 567–588.
{{cite journal}}: Cite journal requires|journal=(help)
وصلات خارجية

|
مقاطعة پلوماس و مقاطعة سييرا | مقاطعة بيوت |
| |
| مقاطعة نيڤادا | مقاطعة سوتر | |||
| مقاطعة پليسر |
قالب:Cities of Yuba County, California قالب:Greater Sacramento قالب:Sacramento Valley
- Pages using gadget WikiMiniAtlas
- Short description is different from Wikidata
- Pages using infobox settlement with no coordinates
- Articles containing إنگليزية-language text
- Pages using Lang-xx templates
- Pages including recorded pronunciations
- Articles with unsourced statements from January 2024
- Convert errors
- Articles with dead external links from January 2025
- Portal-inline template with redlinked portals
- Pages with empty portal template
- Coordinates on Wikidata
- مقاطعة يوبا، كاليفورنيا
- مقاطعات كاليفورنيا
- Counties in the Sacramento metropolitan area
- وادي ساكرامنتو
- تأسيسات 1850 في كاليفورنيا
- أماكن مأهولة تأسست في 1850
- بذرة كاليفورنيا
- صفحات مع الخرائط